Fuller Relationship Graph
A map of R. Buckminster Fuller's network — the 201 people and 11 organizations documented across the Buckyverse, drawn as a graph centered on Fuller and colored by each figure's relationship to him.
Every person page in this wiki carries a controlled relationship: type (collaborator, influence, forebear, chronicler, and so on); this graph renders those ties as spokes to a central Fuller node, and adds the lateral "See Also" connections between the figures themselves. The layout is force-directed — position carries no meaning beyond clustering; color and connection do.
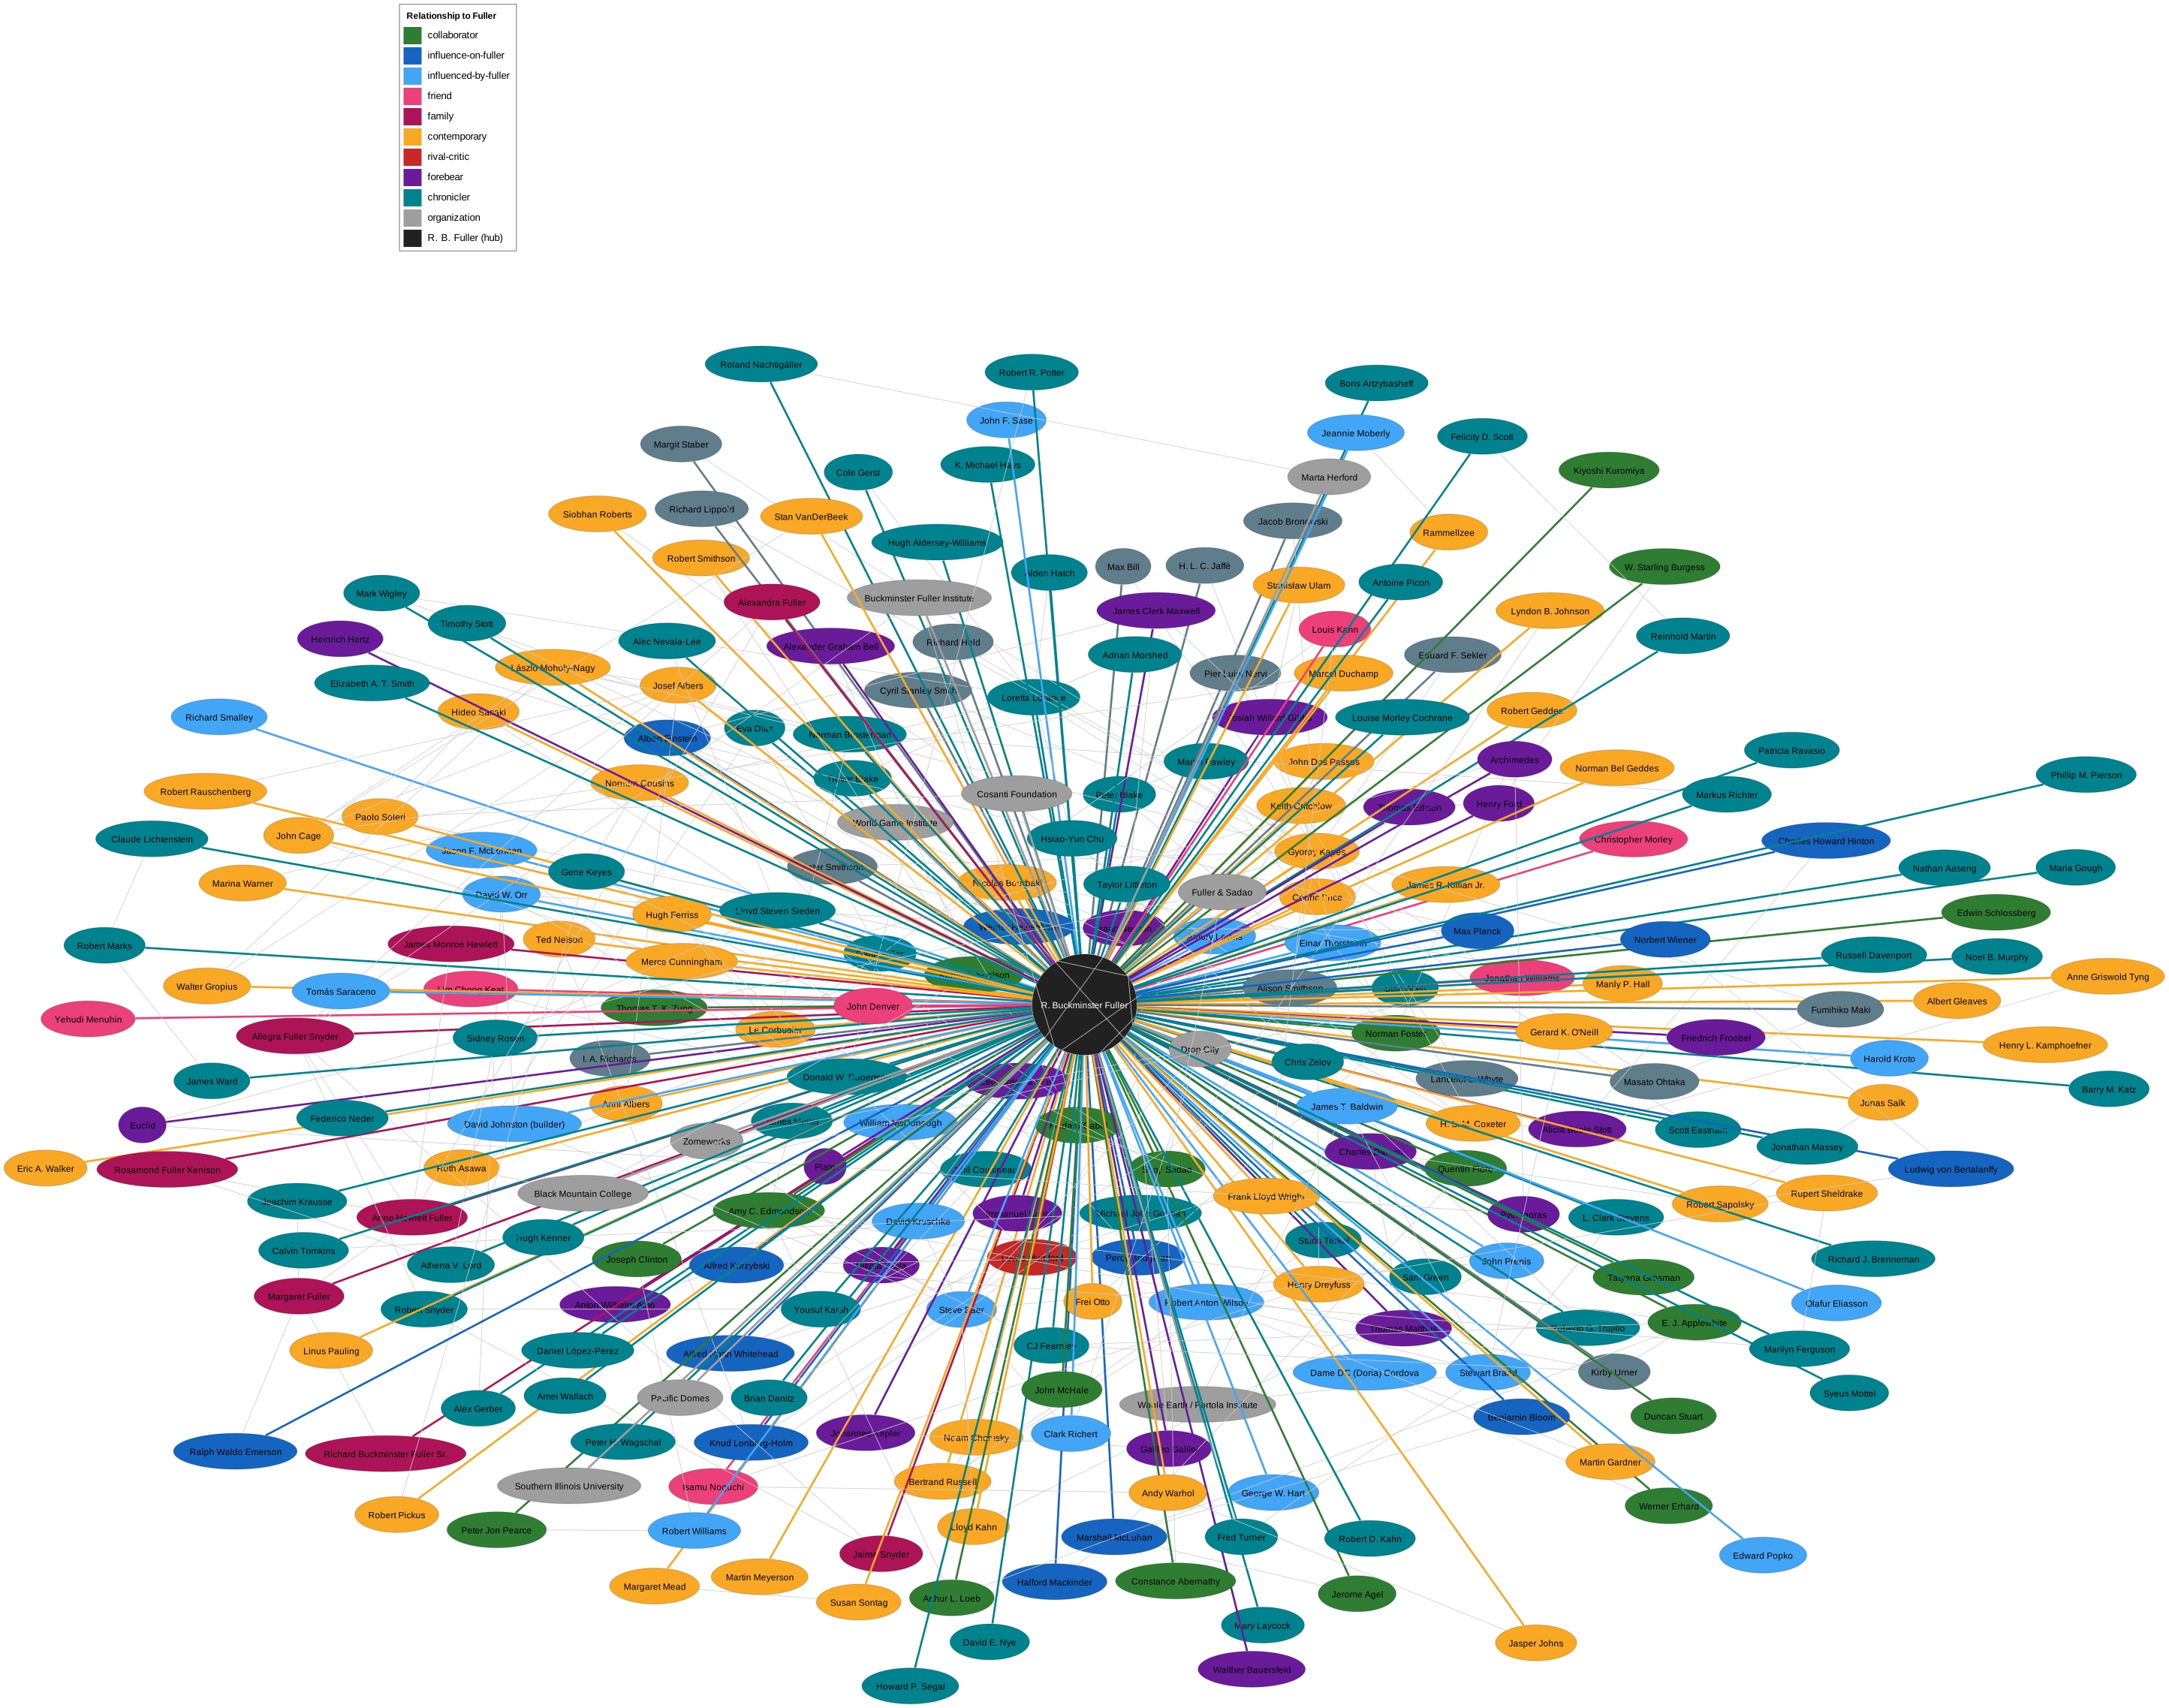
Legend — relationship to Fuller
| Color | Relationship | Meaning | People |
|---|---|---|---|
| 🟩 green | collaborator | Worked with Fuller on a shared project | 20 |
| 🟦 blue | influence-on-fuller | Shaped Fuller's thinking | 14 |
| 🔵 light blue | influenced-by-fuller | Carried Fuller's ideas forward | 19 |
| 🟪 purple | forebear | A predecessor in Fuller's intellectual/design lineage | 22 |
| 🟧 amber | contemporary | A parallel figure of Fuller's era | 51 |
| 🟦 teal | chronicler | Documented or wrote about Fuller | 59 |
| 🩷 pink | friend | A personal friend | 7 |
| 🟥 magenta | family | A relative | 8 |
| 🟥 red | rival-critic | A rival or critic | 1 |
| ⬜ grey | organization | An institution in Fuller's world | 11 |
| ⬛ black | R. Buckminster Fuller | The central hub | 1 |
The graph has 213 nodes and 390 edges: 201 typed person→Fuller spokes, 11 organization spokes, and 178 figure↔figure "See Also" cross-links.
Explore it interactively
The static image above is a snapshot. Below is the fully interactive version — drag and zoom, toggle relationship types on and off, search for a name, and click any node to open that person's page.
Trouble seeing it? Open the interactive graph full-screen.
Both the image and the interactive viewer are produced by the same generator, build_graph.py, from the live wiki data; re-running it rebuilds the graph as the corpus grows.
Source: generated from the Buckyverse entity-person / entity-organization pages (the IMP-16–19 relationship-typing effort, extended by a long-tail corpus audit that added ~100 more figures). Regenerate with python3 build_graph.py.